
Designed TO

Track Parti

ipant,

Analyze Resp

nses &

Eport Findings

after survey distribution.

Designed TO

Track Parti

ipant,

Analyze Resp

nses &

Eport Findings

after survey distribution.

Designed TO

Track Parti

ipant,

Analyze Resp

nses &

Eport Findings

after survey distribution.

Overview

"EDP" Employee Diagnostic Platform is Gartnerโ€™s survey platform for creating, distributing, analyzing and reporting on employee and organizational surveys. I designed the post-distribution experience to help teams track participation, make sense of large response sets and turn findings into reports across

14.86M

responses collected

|

544K

respondents

750K

Assesments and

|

517

Active Clients

In a year from release

Employee diagnostic platform@ gartner.com
Add an image, video, or connect content

So, how did i get here

Let's go back to where it started

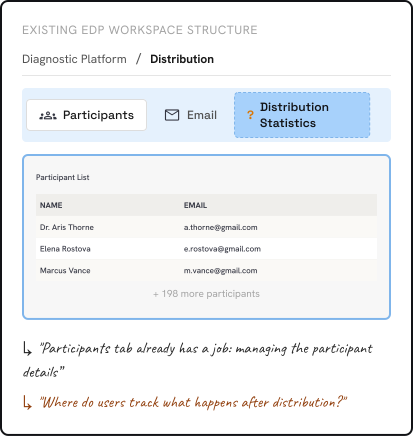
EDP already supported the core survey workflow: creating and configuring surveys, managing participant lists, and distributing surveys to selected populations.

The gap appeared after distribution. Responses could be received, but there was no clear way to understand what was happening before a response came in.

The product knew how to send the survey.

But what happened after the survey was distributed.

Conflict

Problem Journey

โ€œWhat was really

โ€œWhat was really

Going on?โ€

Going on?โ€

Imagine you sent Survey to

200 participants

Survey response received

30/200

Question was โ†’ What happened to the other responses

Reminders kept going without a clear picture of who had progressed and who still needed attention.

Send, wait, send, wait, repeat....
Looking closer

Understanding What The Requirement Really Meant

Create

Add participants

Distribute

Status

"A status column sounded simple. But what were we

actually trying to track?"

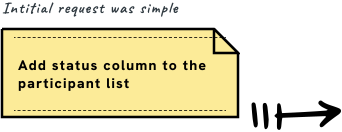
The business request was to add a status column. To understand what it needed to show, I looked at the workflow behind it: when participants were added, how invitations were sent, and how teams followed up when responses were missing.

That raised a bigger question. Were we trying to understand each participant's progress, or how the survey was progressing overall?

Looking closer

Understanding What The Requirement Really Meant

Create

Add participants

Distribute

Status

"A status column sounded simple. But what were we

actually trying to track?"

The business request was to add a status column. To understand what it needed to show, I looked at the workflow behind it: when participants were added, how invitations were sent, and how teams followed up when responses were missing.

That raised a bigger question. Were we trying to understand each participant's progress, or how the survey was progressing overall?

Looking closer

Understanding What The Requirement Really Meant

Create

Add participants

Distribute

Status

"A status column sounded simple. But what were we

actually trying to track?"

The business request was to add a status column. To understand what it needed to show, I looked at the workflow behind it: when participants were added, how invitations were sent, and how teams followed up when responses were missing.

That raised a bigger question. Were we trying to understand each participant's progress, or how the survey was progressing overall?

Challanges

โ€œBUT ADDING STATus column

โ€œBUT ADDING STATus column

โ€œBUT ADDING STATus column

raised more questionsโ€ฆ

raised more questionsโ€ฆ

What type of status?

โ€œDid status mean invitation delivery, individual

survey progress, or participation across the

distribution?โ€

What about people added later?

The initial distribution had already been sent. Newly added participants might still need an invitation.

What if everyone used the same link?

โ€œWith a universal link, responses might not

map back to individual participant records.

What could we reliably track?โ€

The deeper i explored, the clearer it became that adding a column alone wouldn't solve the broader problem.

Conflict with business request
Design Exploration

Connecting the dots across the survey journey

I started by mapping the tracking experience around the events that mattered: when an invitation was sent, whether it was delivered, and what happened as a participant progressed through the survey. I explored the different states, decision points, and exceptions the experience would need to account forโ€”from bounced invitations and participants added later to responses submitted through universal links. This helped me define what the interface needed to communicate, identify the tracking behaviour that required engineering input, and establish the requirements for exploring a more complete distribution experience.


Design Exploration

Connecting the dots across the survey journey

I started by mapping the tracking experience around the events that mattered: when an invitation was sent, whether it was delivered, and what happened as a participant progressed through the survey. I explored the different states, decision points, and exceptions the experience would need to account forโ€”from bounced invitations and participants added later to responses submitted through universal links. This helped me define what the interface needed to communicate, identify the tracking behaviour that required engineering input, and establish the requirements for exploring a more complete distribution experience.


Research & insights

Through this design exploration, I was able to clarified the key requirements, established the project scope, and defined what the Distribution Statistics dashboard needed to include.

Proposed solution

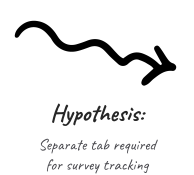
Introduce a Distribution Statistics tab within each distribution, keeping tracking separate from participant management while connecting the overall view to individual participant details.

Switch between distributions

Track invitation delivery

Monitor survey progress

Track & Send reminders

Switch between link type

Demographic filters

Capabilities

PRIMARY AUDIENCE

Internal EDP administrators and the Gartner team managing survey distributions.


DESIGN PROCESS

Bringing the experience together

With the scope defined, I started exploring the information hierarchy and how distribution-level summaries would connect with participant-level details. I worked through the user flows and early layouts while collaborating with my product manager, product owner, and engineers to understand the underlying data and tracking behaviour. This included clarifying how invitation delivery was recorded, which survey-progress states were available, and how unique and universal links affected participant-level tracking. These discussions helped me work through the technical constraints alongside the design decisions, before moving into wireframes and refining the interactions


DESIGN PROCESS

Bringing the experience together

With the scope defined, I started exploring the information hierarchy and how distribution-level summaries would connect with participant-level details. I worked through the user flows and early layouts while collaborating with my product manager, product owner, and engineers to understand the underlying data and tracking behaviour. This included clarifying how invitation delivery was recorded, which survey-progress states were available, and how unique and universal links affected participant-level tracking. These discussions helped me work through the technical constraints alongside the design decisions, before moving into wireframes and refining the interactions


Ideation

VALIDATION, TESTING & FEEDABCK

While external testing was constrained, I conducted internal usability reviews with the product manager and internal users. I walked them through the proposed experience, asked questions around key tasks, and documented their feedback. Once the design was more refined, I shared a feedback form to gather structured input. I also worked with engineering to resolve questions around tracking states and technical feasibility.

Feedback was incorporated iteratively to refine the experience.

Filter complexity:

Users needed a clearer way to navigate demographic attributes and survey-specific questions.

Tracking clarity:

Invitation delivery and survey progress needed to be distinguishable at a glance..

I refined the filtering experience and clarified the separation between distribution-level tracking and participant-level details.

Issues Identified & Refined

VALIDATION, TESTING & FEEDABCK

While external testing was constrained, I conducted internal usability reviews with the product manager and internal users. I walked them through the proposed experience, asked questions around key tasks, and documented their feedback. Once the design was more refined, I shared a feedback form to gather structured input. I also worked with engineering to resolve questions around tracking states and technical feasibility.

Feedback was incorporated iteratively to refine the experience.

Filter complexity:

Users needed a clearer way to navigate demographic attributes and survey-specific questions.

Tracking clarity:

Invitation delivery and survey progress needed to be distinguishable at a glance..

I refined the filtering experience and clarified the separation between distribution-level tracking and participant-level details.

Issues Identified & Refined

Employee diagnostic platform@ gartner.com
Add an image, video, or connect content

Outcome

Introduced a dedicated view for tracking survey distributions and participant progress

Reduced reliance on manual tracking and email coordination.

Made it easier to find participants who may need follow-up.

Made it easier to find participants who may need follow-up.

14.86M

responses collected

|

544K

respondents

750K

Assesments and

|

517

Active Clients

In a year from release

KEY LEARNINGS

Strong stakeholder alignment is critical under tight timelines

Complex problems don't always require complex interfaces; clarity and prioritisation matter.

Even partial automation can dramatically reduce cognitive load

Final thought

This project reinforced my belief that great design isn't about adding more features; it's about removing friction. By grounding decisions in user needs, business requirements, and technical constraints, I helped make a fragmented tracking process clearer and easier to manage.

Outcome

Introduced a dedicated view for tracking survey distributions and participant progress

Reduced reliance on manual tracking and email coordination.

Made it easier to find participants who may need follow-up.

Made it easier to find participants who may need follow-up.

14.86M

responses collected

|

544K

respondents

750K

Assesments and

|

517

Active Clients

In a year from release

KEY LEARNINGS

Strong stakeholder alignment is critical under tight timelines.

Complex problems don't always require complex interfaces; clarity and prioritisation matter.

Even partial automation can dramatically reduce cognitive load.

Final thought

This project reinforced my belief that great design isn't about adding more features; it's about removing friction. By grounding decisions in user needs, business requirements, and technical constraints, I helped make a fragmented tracking process clearer and easier to manage.

Create a free website with Framer, the website builder loved by startups, designers and agencies.